The Stats dashboard gives you an overview of the progress of your surveys. You can drill down a little deeper on stats you're interested in, such as survey completion rates, products selected in completed surveys, and more.

The Dashboard
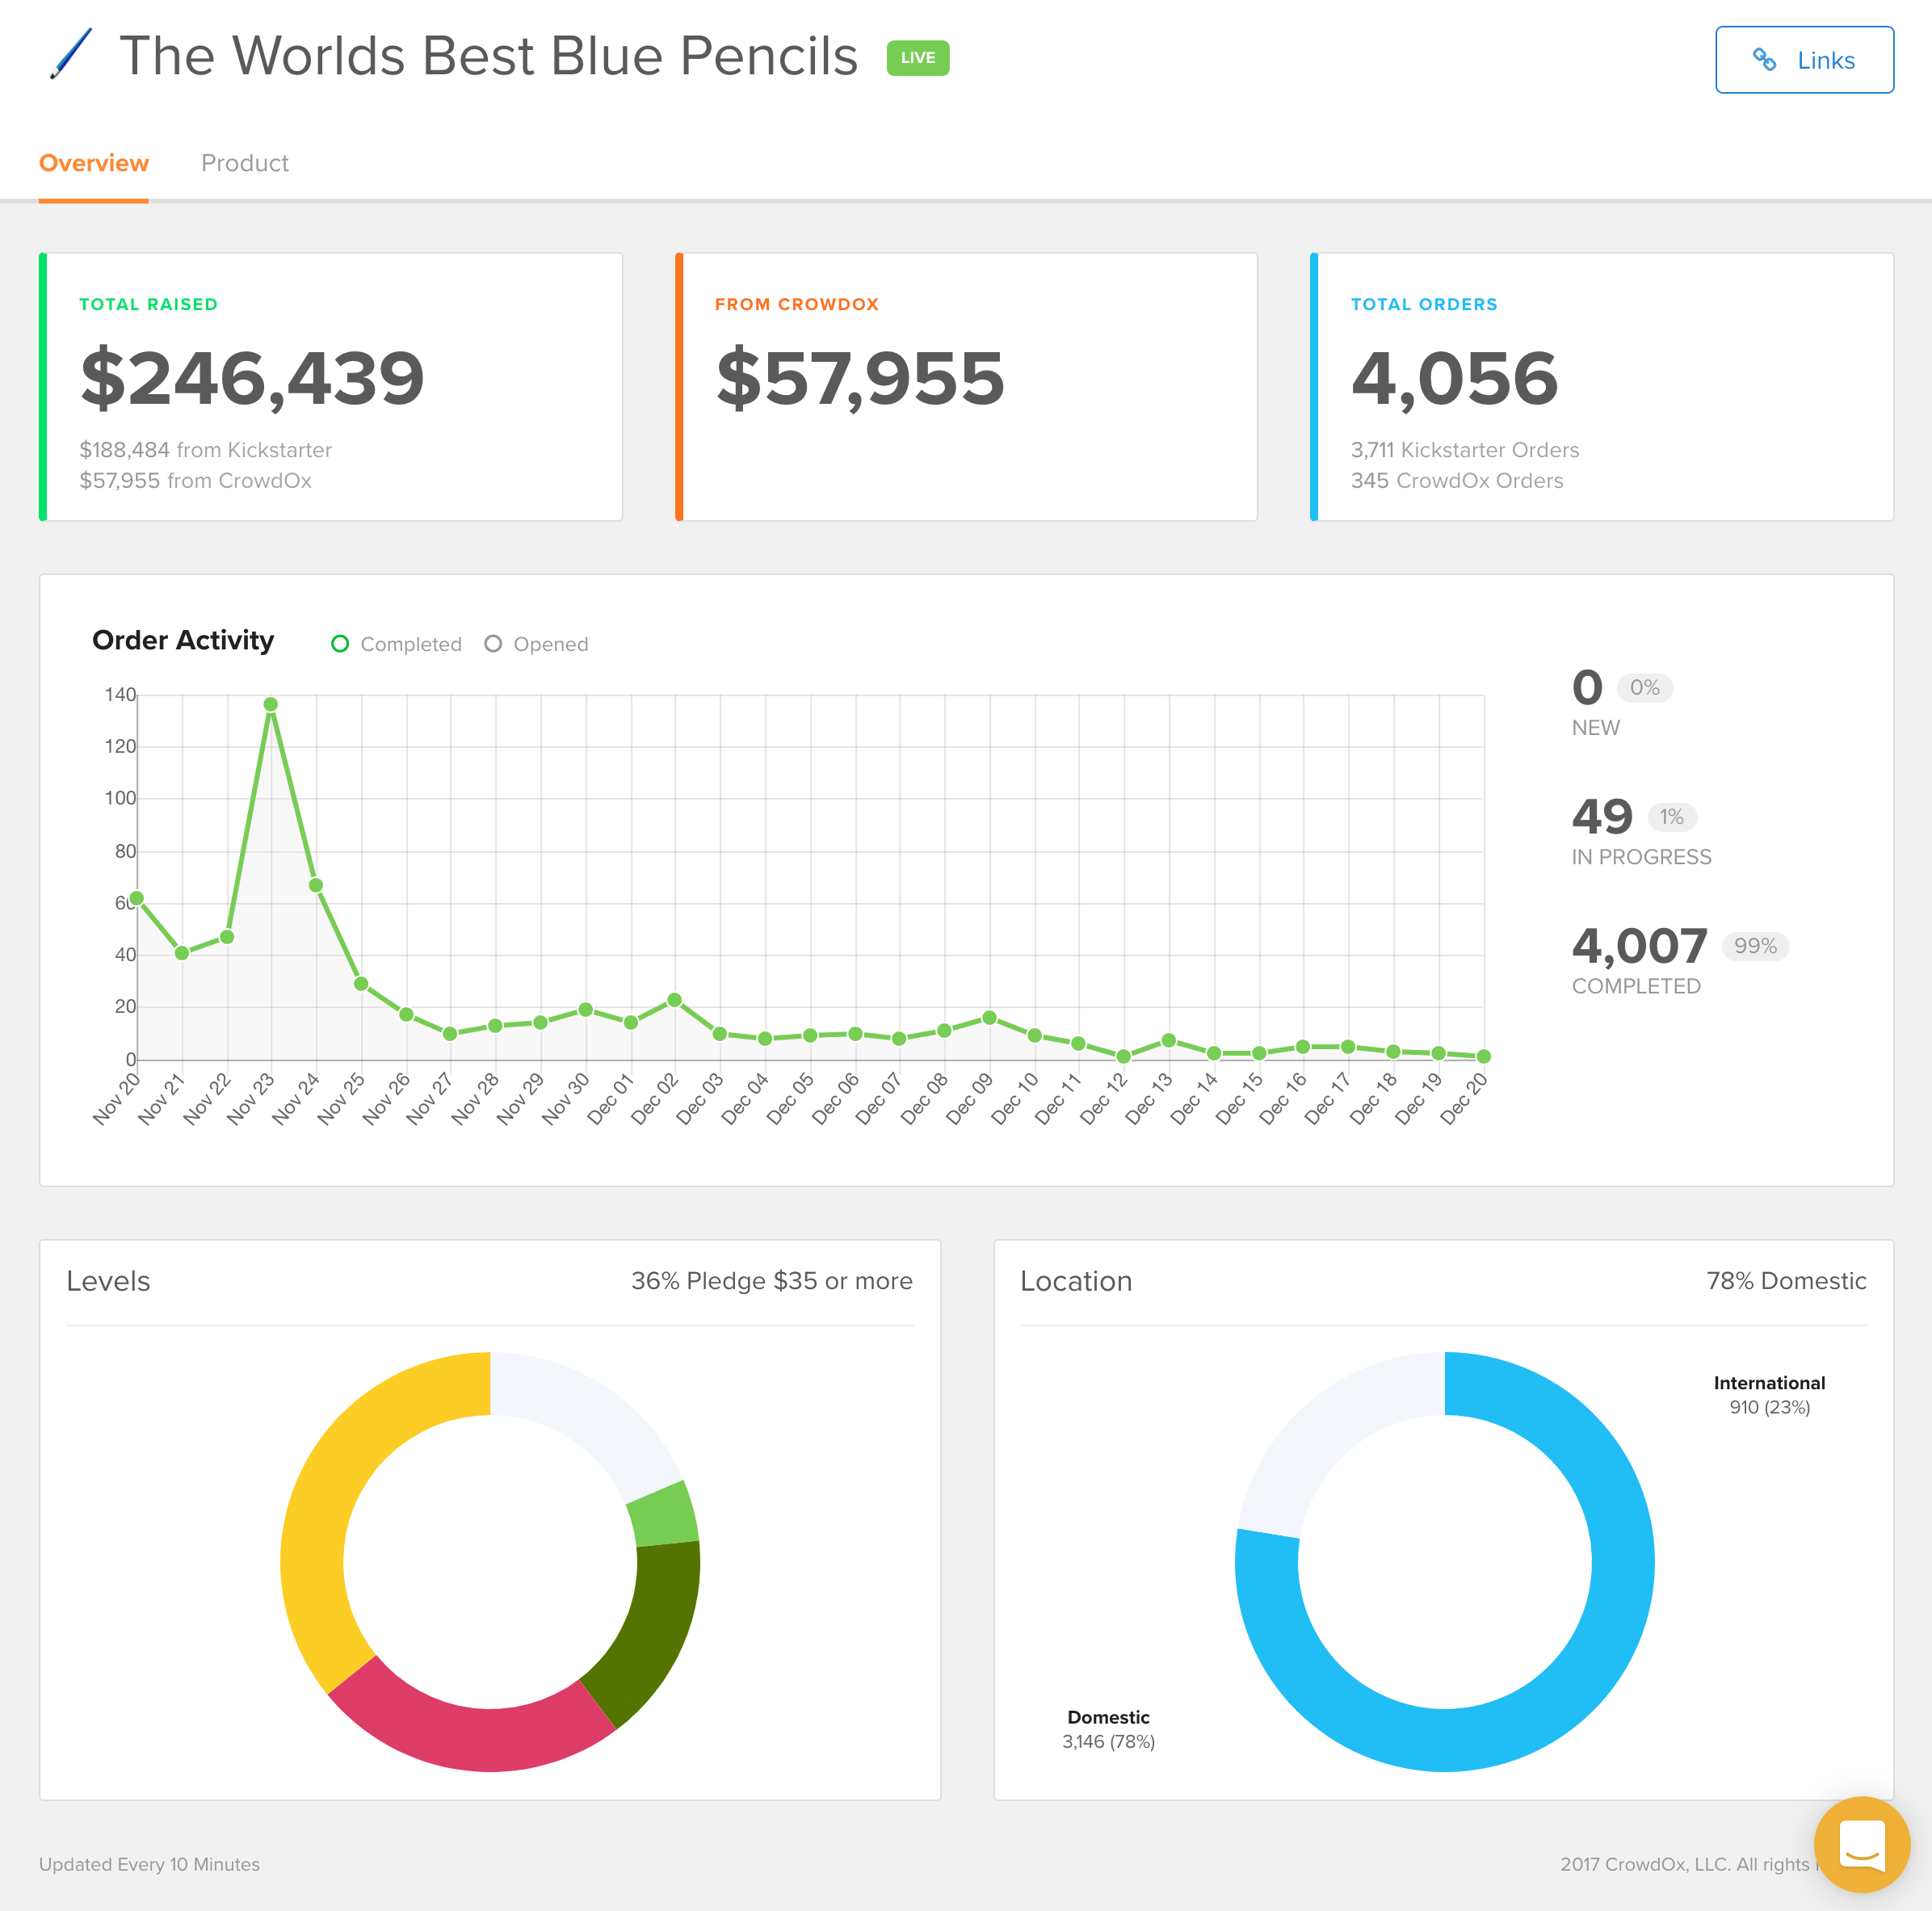
The dashboard itself gives you a bird's eye view of your campaign. Below are more details on each component.
Total Raised
The Total Raised box shows the total amount of funds raised from all sources, less dropped or otherwise failed backers from your crowdfunding campaign.
From CrowdOx
This box shows the total amount of additional funding your campaign has raised on the CrowdOx platform, including upgraded tiers, add-ons, and pre-orders.
Total Orders
The Total Orders box shows the total number of orders by backers from all sources.
Order Activity
The Order Activity chart shows a timeline of order completion, broken down by date. The graph includes completed surveys as well as surveys that have been opened, but not completed. The percentages on the right side show:
- New: This indicates the number and percentage of surveys that have not been started for any reason.
- In Progress: This stat indicates the number and percentage of surveys that have been opened and started, but not completed.
- Completed: This indicates the number and percentage of surveys that have been completed.
Levels
The Levels box shows a graphical representation of the number of orders for each pledge level. The upper right stat in the box indicates the pledge level with the most orders. Hover over any of the colors to get more information on each level and the number of orders for each one.
Location
The Location box gives you an overview of how many orders are domestic orders versus the number of orders which are international. The domestic count is based on the country where the project is located.
Product Stats
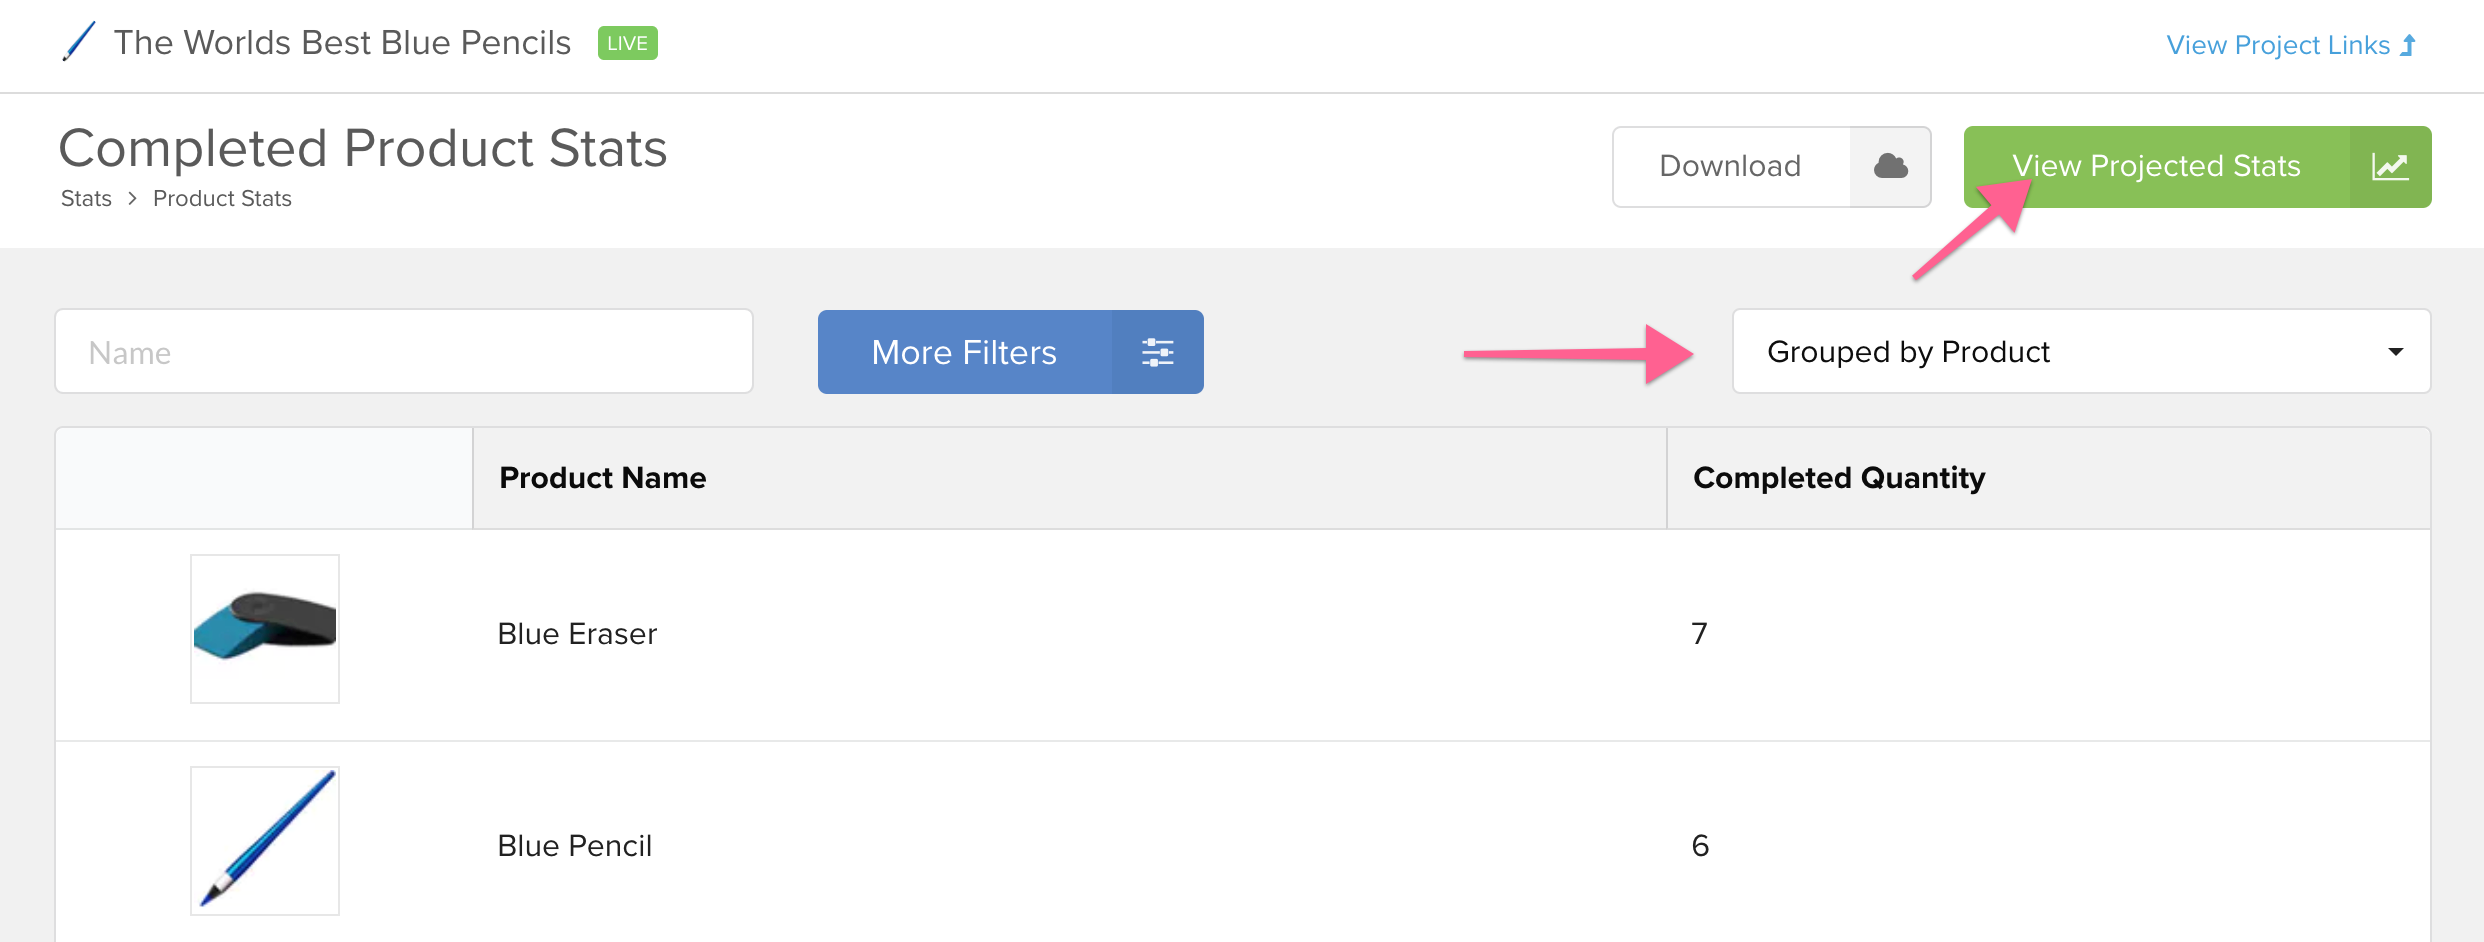
You can also get details on product statistics on the Stats page. Click Product Stats on the left side Stats sub-menu to get started. You can view these stats grouped by product, SKU, or variation using the drop down menu on the right side of the page. Click the green View Projected Stats button on the top right to get an estimate of projected product orders. Click the Download button to download an export in Excel or CSV format.

More information is available with exports. You can download certain exports and work with the data in them to get more insight into how your surveys are doing. To learn more about exports, click here. To learn more about working with specific orders or sets of orders, click here.

